Diagnostic Testing
Labii can be used as a LIMS for documenting qPCR Cq values and calculating test results.
Overview
Often, diagnostic tests are used to examine a specific concern in order to determine whether it is caused by disease or not. They are also often used to diagnose conditions in patients with symptoms or asymptomatic patients with a positive screening test.
Labii can be used as a LIMS for documenting qPCR Cq values and calculating test results.
Configuration
In order to use the Diagnostic testing functions in Labii, you must first install the Diagnostic testing application. If Diagnostic testing application is selected when creating the account, then this step can be skipped.
Select Applications from Settings -> Applications
Click Add application and select Add from a template
Choose Diagnostic testing from the pop-out modal. A lack of such an option indicates that you have already installed it.
Following the configuration, you should have the following tables installed:
qPCR CT Ranges
qPCR Cq
qPCR Reports
Usage
Before start: Prepare thresholds
In order to analyze or predict pathogen loads, thresholds or Ct ranges must first be created. It is only necessary to prepare threshold data once.
Click Diagnostic Testing app and then click qPCR Ct Ranges table.
Click Add qPCR Ct Range in the list view of qPCR Ct Ranges and choose Add blank qPCR Ct Ranges
Enter the pathogen's name in the Name field
Fill in the low, medium, and high Ct thresholds
If applicable, update the treatment and antibiotic resistance information

Thresholds can also be imported in bulk using the Import function. Please find an example Excel file ready for import below.

Generate report with process management
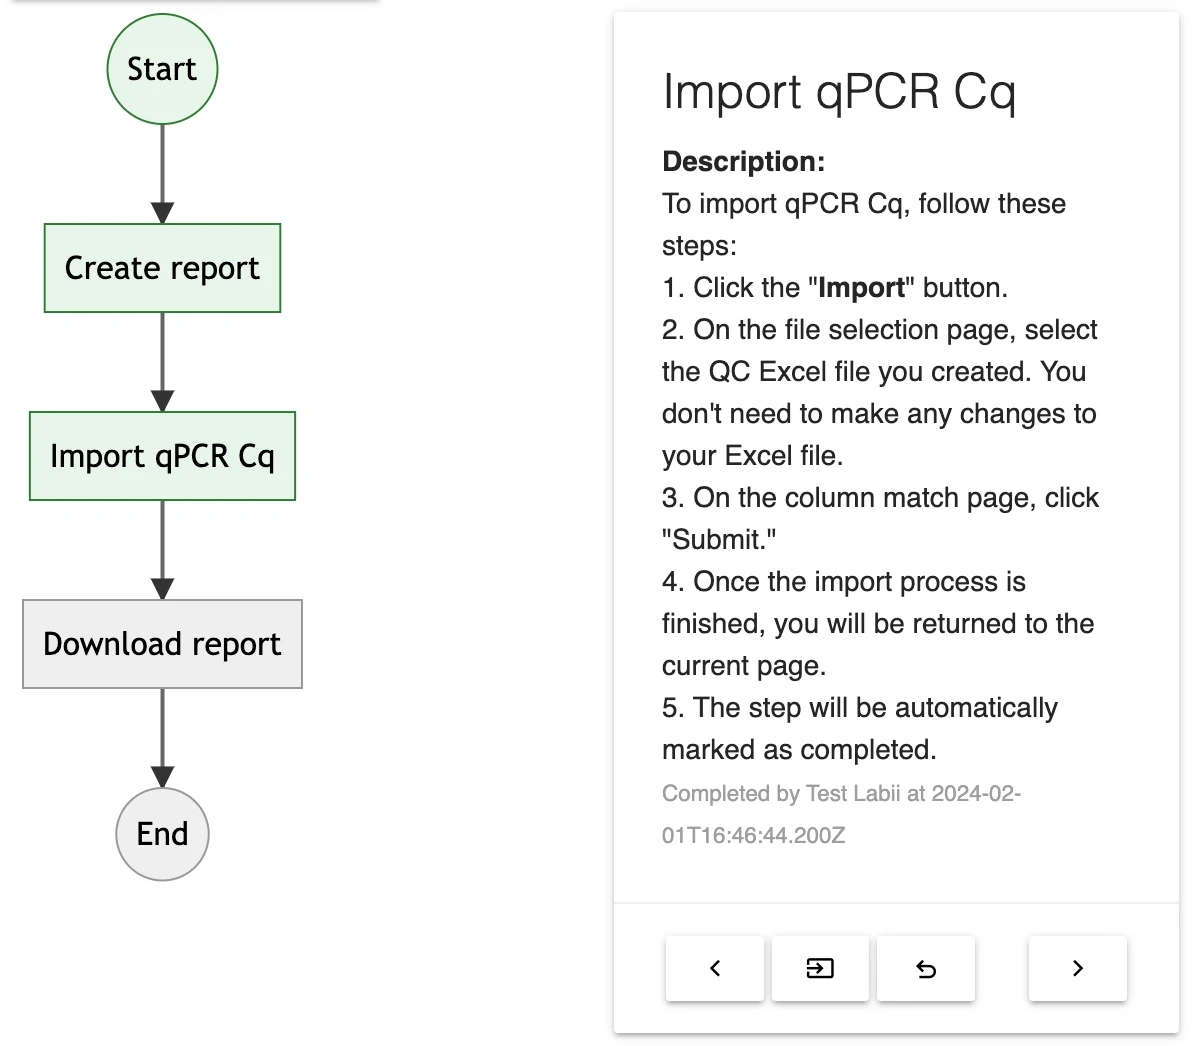
Labii's process management for diagnostic testing streamlines the workflow into a seamless and efficient experience. This user-friendly system guides users through a well-defined flowchart, eliminating the need for manual navigation. The process involves three key steps: report creation, Cq value import, and report download. Users can effortlessly complete these tasks in a structured manner, ensuring precision and ease of use throughout the diagnostic testing procedure.

Generate Report
To create a report, navigate to the "Add" menu, select "Report," and provide all the necessary details.
Once added, the workflow's initial section will display, automatically marking the first step, "Create report," as complete.
Import qPCR Cq Values
Proceed to the second step and click the "Import" button to upload qPCR Cq values.
Choose the qPCR Cq values exported from your software. If it's a standard qPCR export file with the title row at row 20, you can simply click the "Submit" button. Otherwise, you have the option to adjust the "Title row's row number" to correspond with your title row's position. Refer to the image below for an example of qPCR Cq values.
On the column matching page, the system will automatically match all columns. If your sheet contains different columns, be sure to align them with Labii's configuration.
Click the "Submit" button to initiate the import process for all Cq values individually. Upon successful completion, the page will return to the report section, and the second step will be marked as completed automatically.
Download Report
To obtain the report, select the "Download" button in the download report step. This step will execute result prediction, prepare the report, initiate the download, and close the new tab directly. Once the report is downloaded, the step will be marked as complete.

Generate report manually
You can also genereate report manually:
1. Import Cq values
You can import Cq values into Labii after preparing the threshold.
Export your RT-PCR data in *.tsv or *.xlsx format
Click Diagnostic Testing app and select qPCR Cq table in Labii
Once you've clicked Import, select the exported file, and click Submit
Match file headers with column names.
Importing can be started by clicking Submit.
Once imported, enable editing mode to analyze data.
Disable editing once it has been completed.

2. Generate reports
You can start generating reports once the analysis is complete:
Click Diagnostic Testing app and then click qPCR Reports table.
Click Add qPCR Report in the list view of qPCR Reports and select Add blank qPCR Report.
Complete the Clinic Information, Laboratory Information, Patient Information, and Specimen Information fields
Click the Submit button
In the qPCR Cq table, simply select the Cqs you wish to include in the report from the list.
Then click Bulk Edit, select the Report column, and select the report you just created from the drop-down list
Submit the form by clicking the Submit button.
Open your newly created report once it has been created.
To generate the report, click the Print button.
If you don't want to see certain sections, you can hide them.
To print, click the Print button.

Last updated