> For the complete documentation index, see [llms.txt](https://docs.labii.com/llms.txt). Markdown versions of documentation pages are available by appending `.md` to page URLs; this page is available as [Markdown](https://docs.labii.com/applications/electronic-lab-notebook/eln-for-dose-response-curve.md).
# ELN for Dose Response Curve
## Overview
[Labii Electronic Lab Notebook (ELN) for Dose Response Curve](https://www.labii.com/products/electronic-lab-notebook-eln-for-dose-response-curve) is a specialized solution designed to simplify and accelerate the process of dose-response experimentation and analysis. With its dedicated Dose Response Curve widget, Labii provides a structured layout for inputting concentrations and responses, automates the application of a 4-parameter logistic (4PL) model for curve fitting, and delivers precise standard curve generation with minimal manual effort. This robust tool enhances experimental accuracy and efficiency, making it ideal for researchers working with pharmacological assays, ELISAs, and other bioassays where modeling dose-response relationships is critical.
The dose-response curve is a critical tool in understanding how varying levels of exposure to a stressor affect an organism. It's commonly used in different fields, from pharmaceuticals to environmental studies, to determine safe levels of exposure or dosage.
Labii ELN for Dose Response Curve - Streamlined dose-response analysis
{% hint style="info" %}
Watch our [demo video](https://youtu.be/1zA-_fdLQaA) to see the Dose Response Curve widget in action, or explore the detailed [widget documentation](https://docs.labii.com/widgets/section-widgets/biology/dose-response-curve).
{% endhint %}
## Installation
To install the Electronic Lab Notebook (ELN) for Dose Response Curve application:
{% stepper %}
{% step %}
Navigate to **Settings** and select **Applications**
{% endstep %}
{% step %}
Click **Add application** and select **Add from a template**
{% endstep %}
{% step %}
Choose **Electronic Lab Notebook (ELN) for Dose Response Curve** from the template list
{% hint style="info" %}
If the application is not available in the list, it may already be installed in your workspace.
{% endhint %}
{% endstep %}
{% endstepper %}
## Design
The application consists of two tables: "drc" and "protocol".
1. Table "drc":
* Columns:
* date\_start (required)
* date\_due
* signature\_status
* Sections:
* DRC Workflow: A flowchart widget that guides the user through the experiment steps.
* Experiment Overview
* Experiment Procedure
* Dose Response Curve: A Dose Response Curve widget that helps in preparing layouts and analyzing data.
* Other Files: A Files widget for attaching additional files to the experiment.
* Experiment Signers
## General Usage
The general usage of the application includes:
* Creating new records: Users can create new Dose Response Curve records by filling in the required fields, such as the start date. They can also provide additional information in the experiment overview and procedure sections.
* Managing records in the table list view: Users can navigate through the list view of Dose Response Curve records and perform actions like editing, deleting, or sorting the records.
* Viewing record details: Users can access the detailed view of a specific Dose Response Curve record to see all the sections and widgets associated with it.
## Special Usage
The Labii ELN for Dose Response Curve application offers a specialized workflow and Dose Response Curve widget that simplifies conducting and analyzing dose-response experiments.
### Workflow
The DRC Workflow section provides a step-by-step flowchart guiding users through the various stages of the experiment, from providing an overview to conducting the experiment, preparing layouts and data, performing the analysis, and signing the experiment.
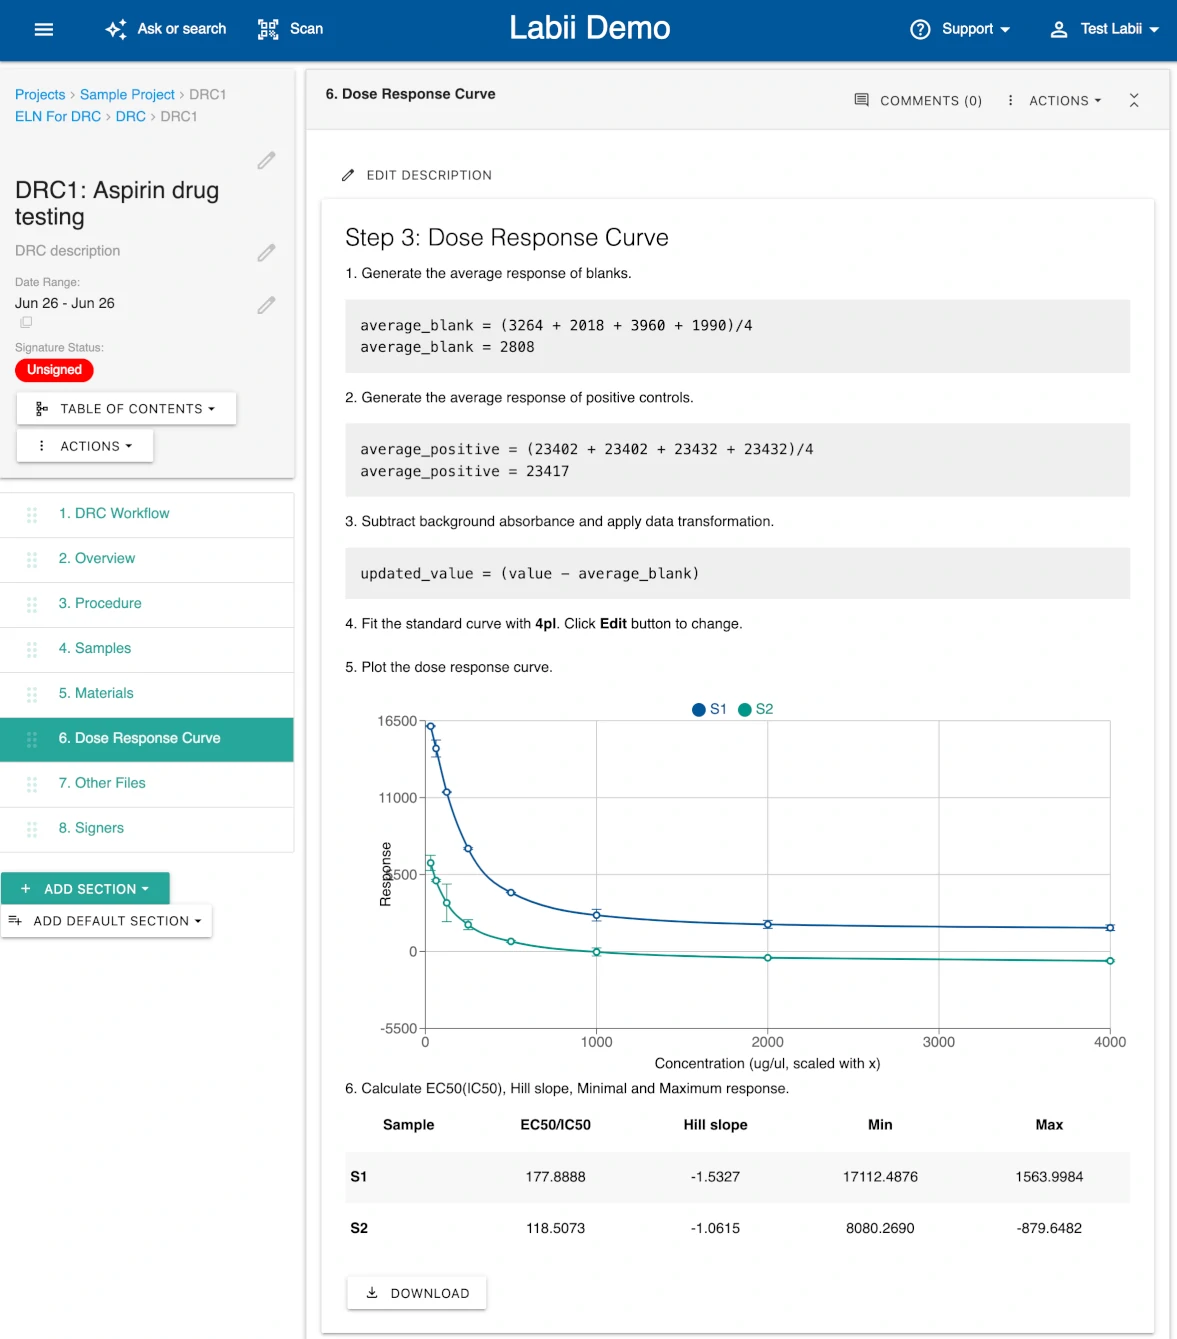
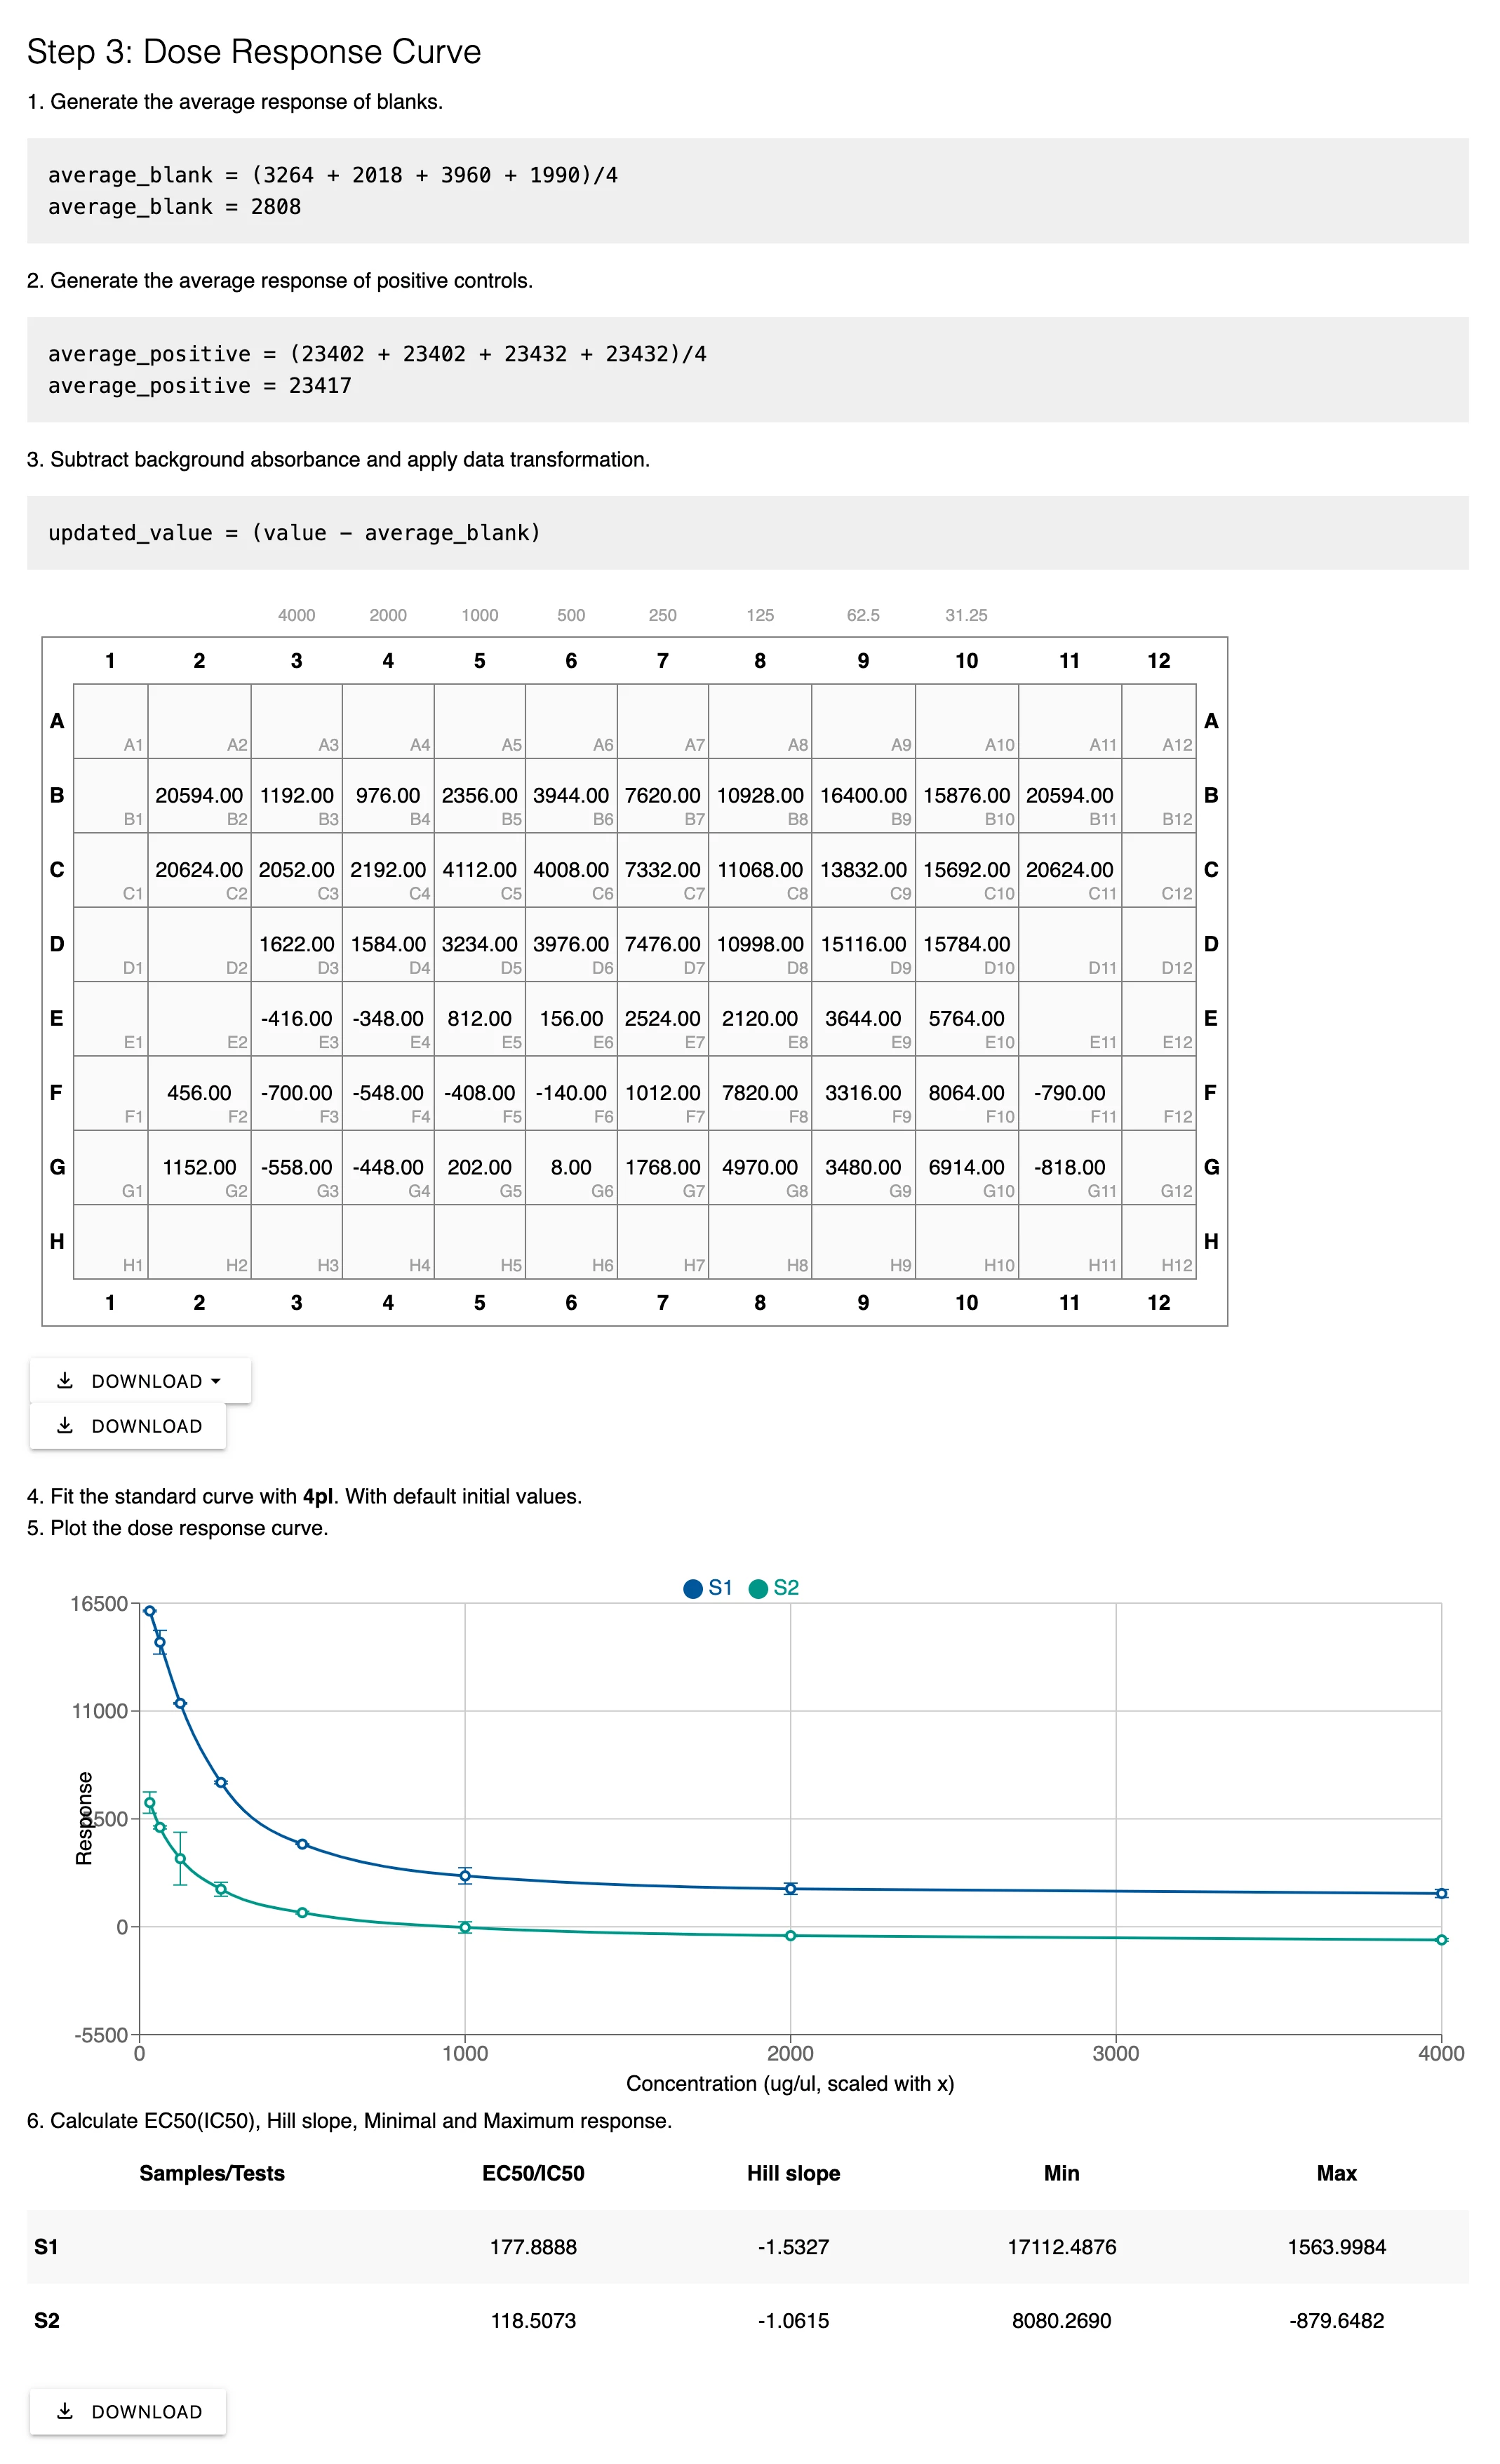
### Dose Response Curve Widget
Labii's Dose Response Curve widget transforms complex dose-response curve generation into a streamlined, user-friendly workflow. The widget supports flexible data entry with clearly defined rules for concentrations, blanks, and controls. It automatically calculates background-corrected averages, applies a robust Four Parameter Logistic (4PL) model, and visualizes the results with interactive plots and confidence intervals.
The process involves three main steps:
{% stepper %}
{% step %}
**Prepare Layout**
Set up the 96-well plate layout with concentration values:
* Input data manually or import from files
* Mark concentrations using specific conventions
* Define blank wells and positive controls
* Organize your dose-response experimental design
{% endstep %}
{% step %}
**Prepare Response Data**
Enter the response data into the 96-well plate:
* Input measured responses for each well
* Similar data entry methods as layout preparation
* Empty wells can be excluded from analysis
* Supports various data import formats
{% endstep %}
{% step %}
**Automated Analysis**
The widget automatically performs comprehensive analysis:
* **Baseline Calculation**: Generates average responses of blanks and positive controls to establish baselines
* **Background Correction**: Subtracts background values and applies data transformations as needed
* **4PL Curve Fitting**: Fits a four-parameter logistic (4PL) curve using the Levenberg–Marquardt algorithm to characterize the dose-response relationship
* **Visualization**: Plots the dose-response curve with data points, estimated plots, and confidence intervals
* **Key Parameters**: Calculates EC50 (or IC50), Hill slope, minimum, and maximum responses
{% hint style="success" %}
**Advanced Tuning Options**: Fine-tune settings including response value transformations, X-axis scale adjustments, and initial parameters for the algorithm to improve curve fitting with challenging datasets. Intelligent warnings help ensure precision even with complex data patterns.
{% endhint %}
{% endstep %}
{% endstepper %}
Effortless dose-response analysis in three simple steps
{% hint style="warning" %}
While the algorithm aims for the best fit, it might not always find the optimal solution with complex data patterns. Use the advanced tuning options to adjust initial guesses or try different settings when working with challenging datasets.
{% endhint %}
## Includes All Features of Labii ELN for Production
Labii ELN for Dose Response Curve inherits all the robust capabilities of the [ELN for Production](https://www.labii.com/products/electronic-lab-notebook-eln-for-production), including:
* **Structured Data Layouts**: Organized templates for consistent documentation
* **Automated Templates**: Pre-configured workflows to accelerate experimentation
* **Version Control**: Track all changes and maintain complete revision history
* **Access Permissions**: Granular control over who can view and edit data
* **Full Audit Trails**: Complete documentation of all activities for compliance
* **Regulatory Compliance**: Meets FDA 21 CFR Part 11 requirements
* **Electronic Signatures**: Secure signing workflows for data approval
{% hint style="success" %}
This ensures your dose-response curve documentation meets both scientific and compliance demands—without compromising flexibility or ease of use.
{% endhint %}
## Related Applications
Explore other specialized ELN solutions from Labii:
* [Electronic Lab Notebook (ELN) for Research and Development](https://www.labii.com/products/electronic-lab-notebook-eln-for-research-and-development)
* [Electronic Lab Notebook (ELN) for Production](https://www.labii.com/products/electronic-lab-notebook-eln-for-production)
* [Electronic Lab Notebook (ELN) for ELISA Data Analysis](https://www.labii.com/products/electronic-lab-notebook-eln-for-elisa)
## Conclusion
[Labii ELN's Electronic Lab Notebook (ELN) for Dose Response Curve](https://www.labii.com/products/electronic-lab-notebook-eln-for-dose-response-curve) provides researchers with a comprehensive solution for conducting dose-response experiments and analyzing the obtained data. Through the specialized workflow and Dose Response Curve widget, researchers can streamline their experimental workflows, ensure precision and accuracy, and enhance the overall reliability of scientific investigations. With automated 4PL curve fitting, interactive visualizations, and full regulatory compliance features, Labii makes dose-response analysis accessible and efficient for pharmacological assays, ELISAs, and other critical bioassays.