ELN for ELISA provides integrated tools for plate layout, data entry, and automated standard curve analysis
ELN for ELISA provides integrated tools for plate layout, data entry, and automated standard curve analysis
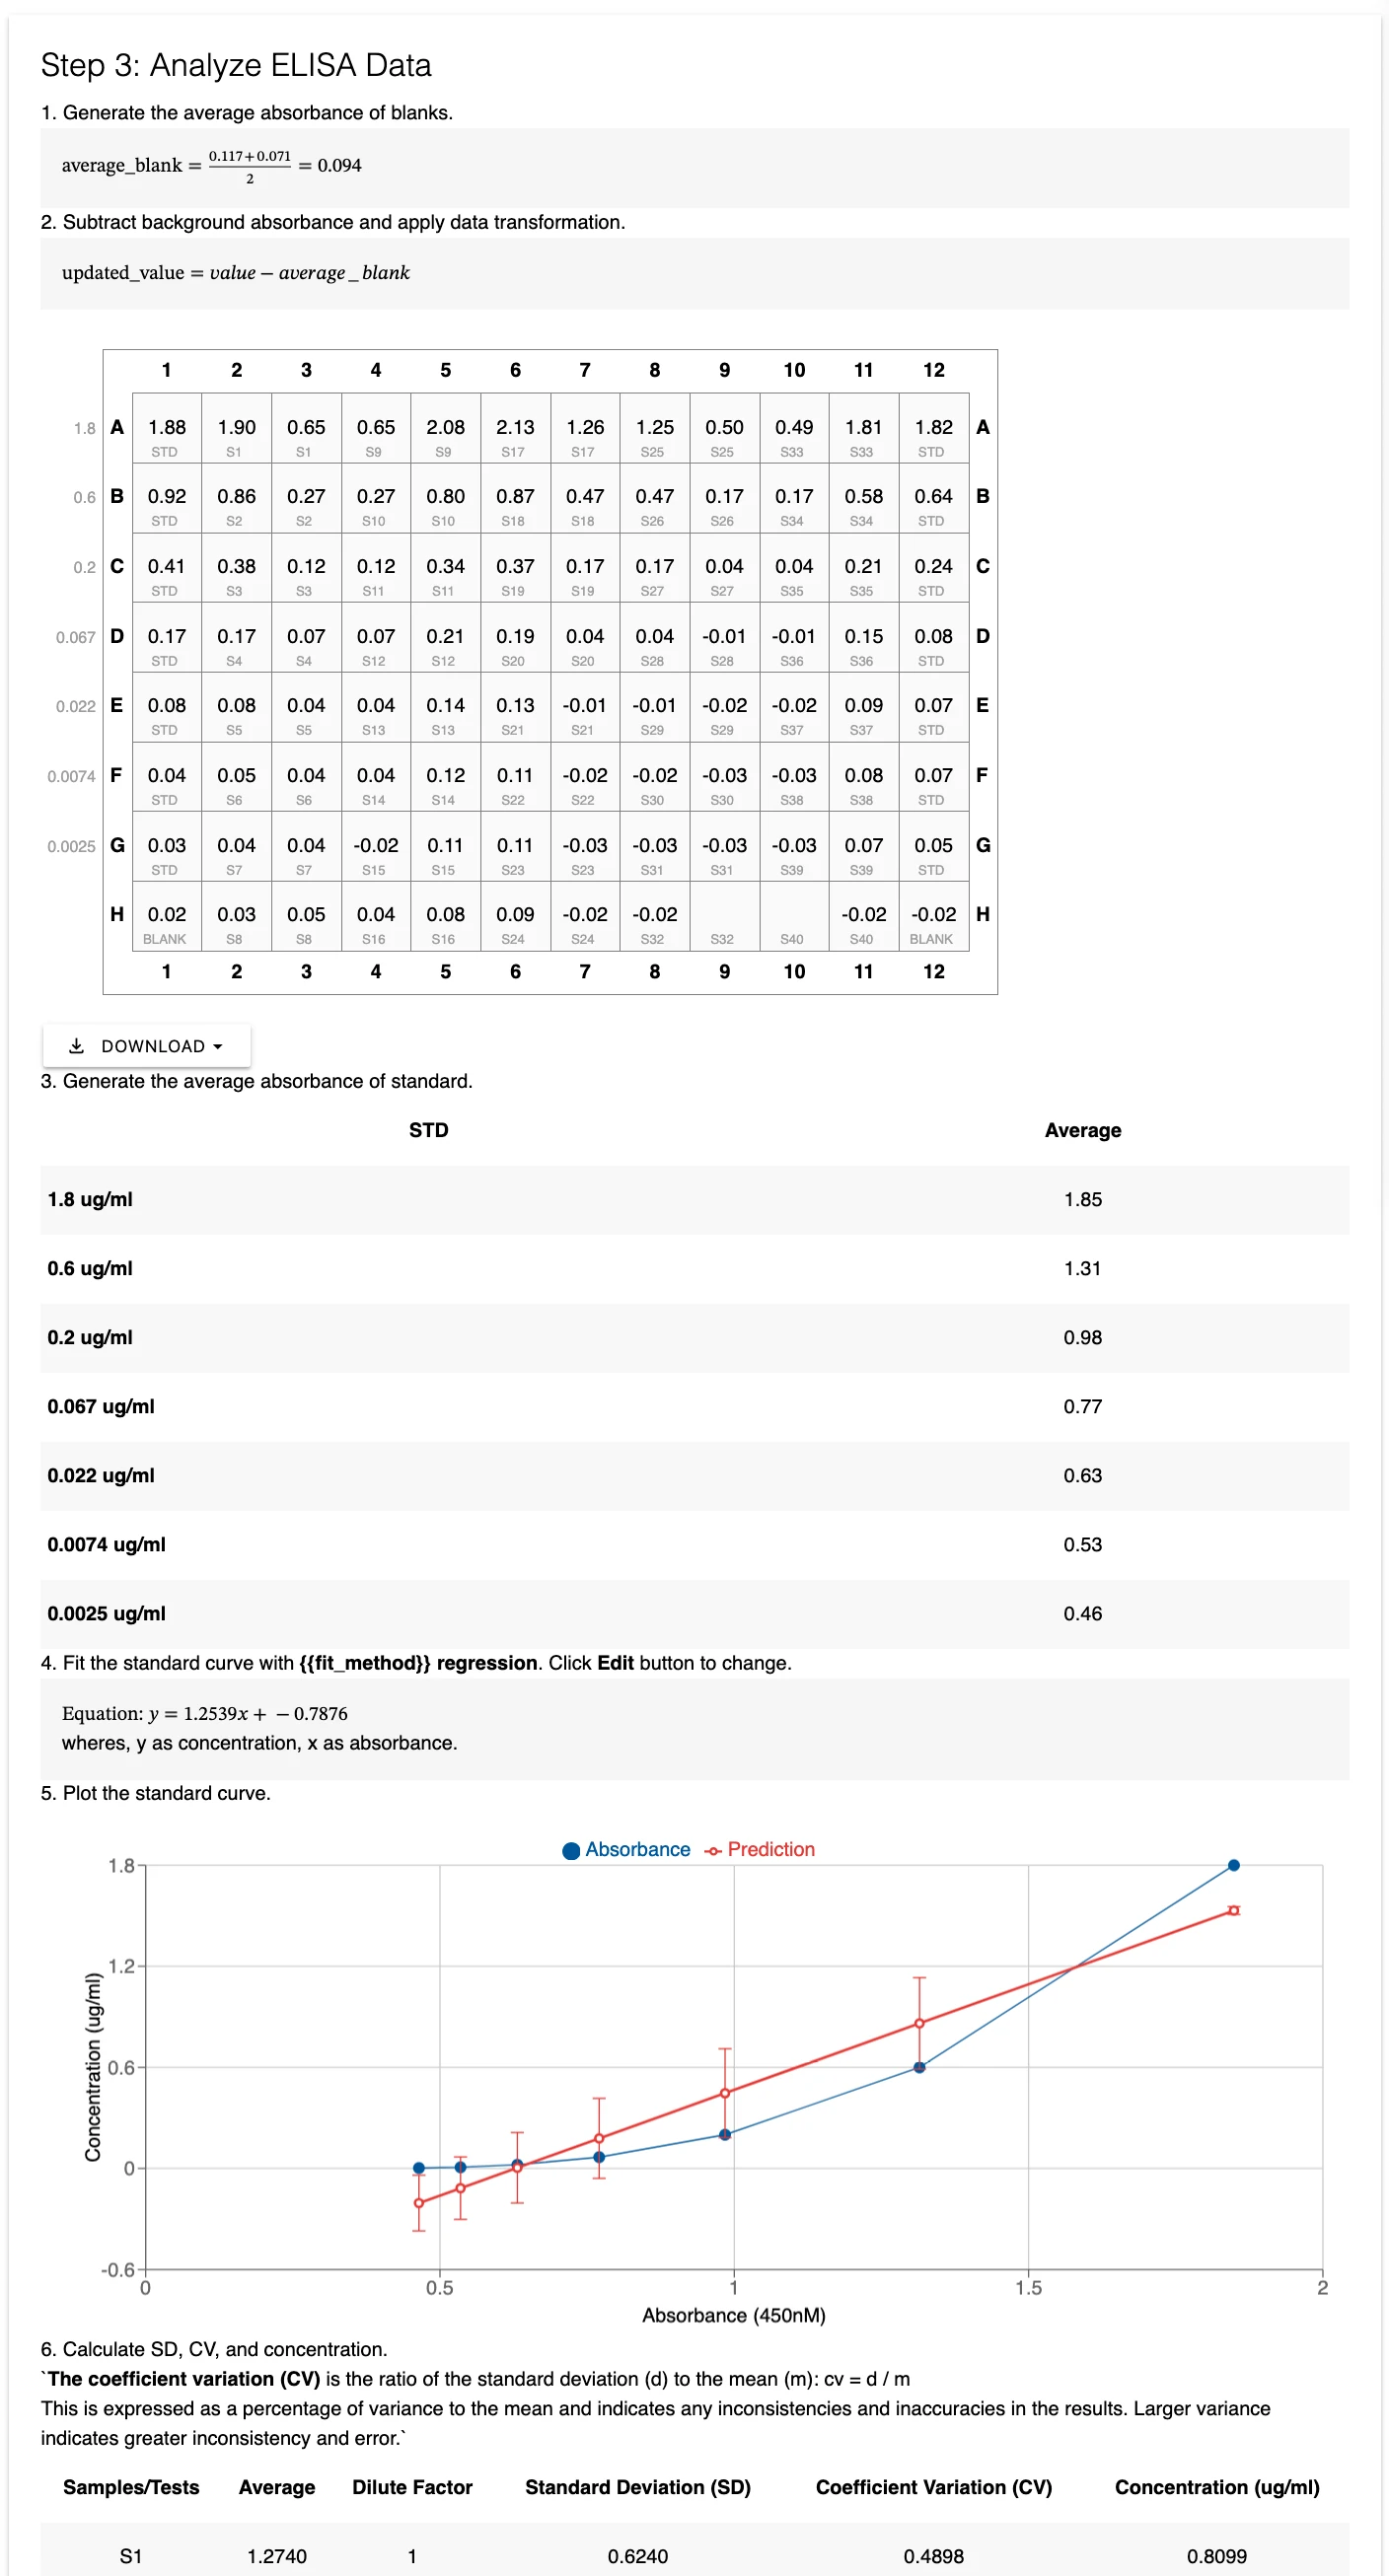
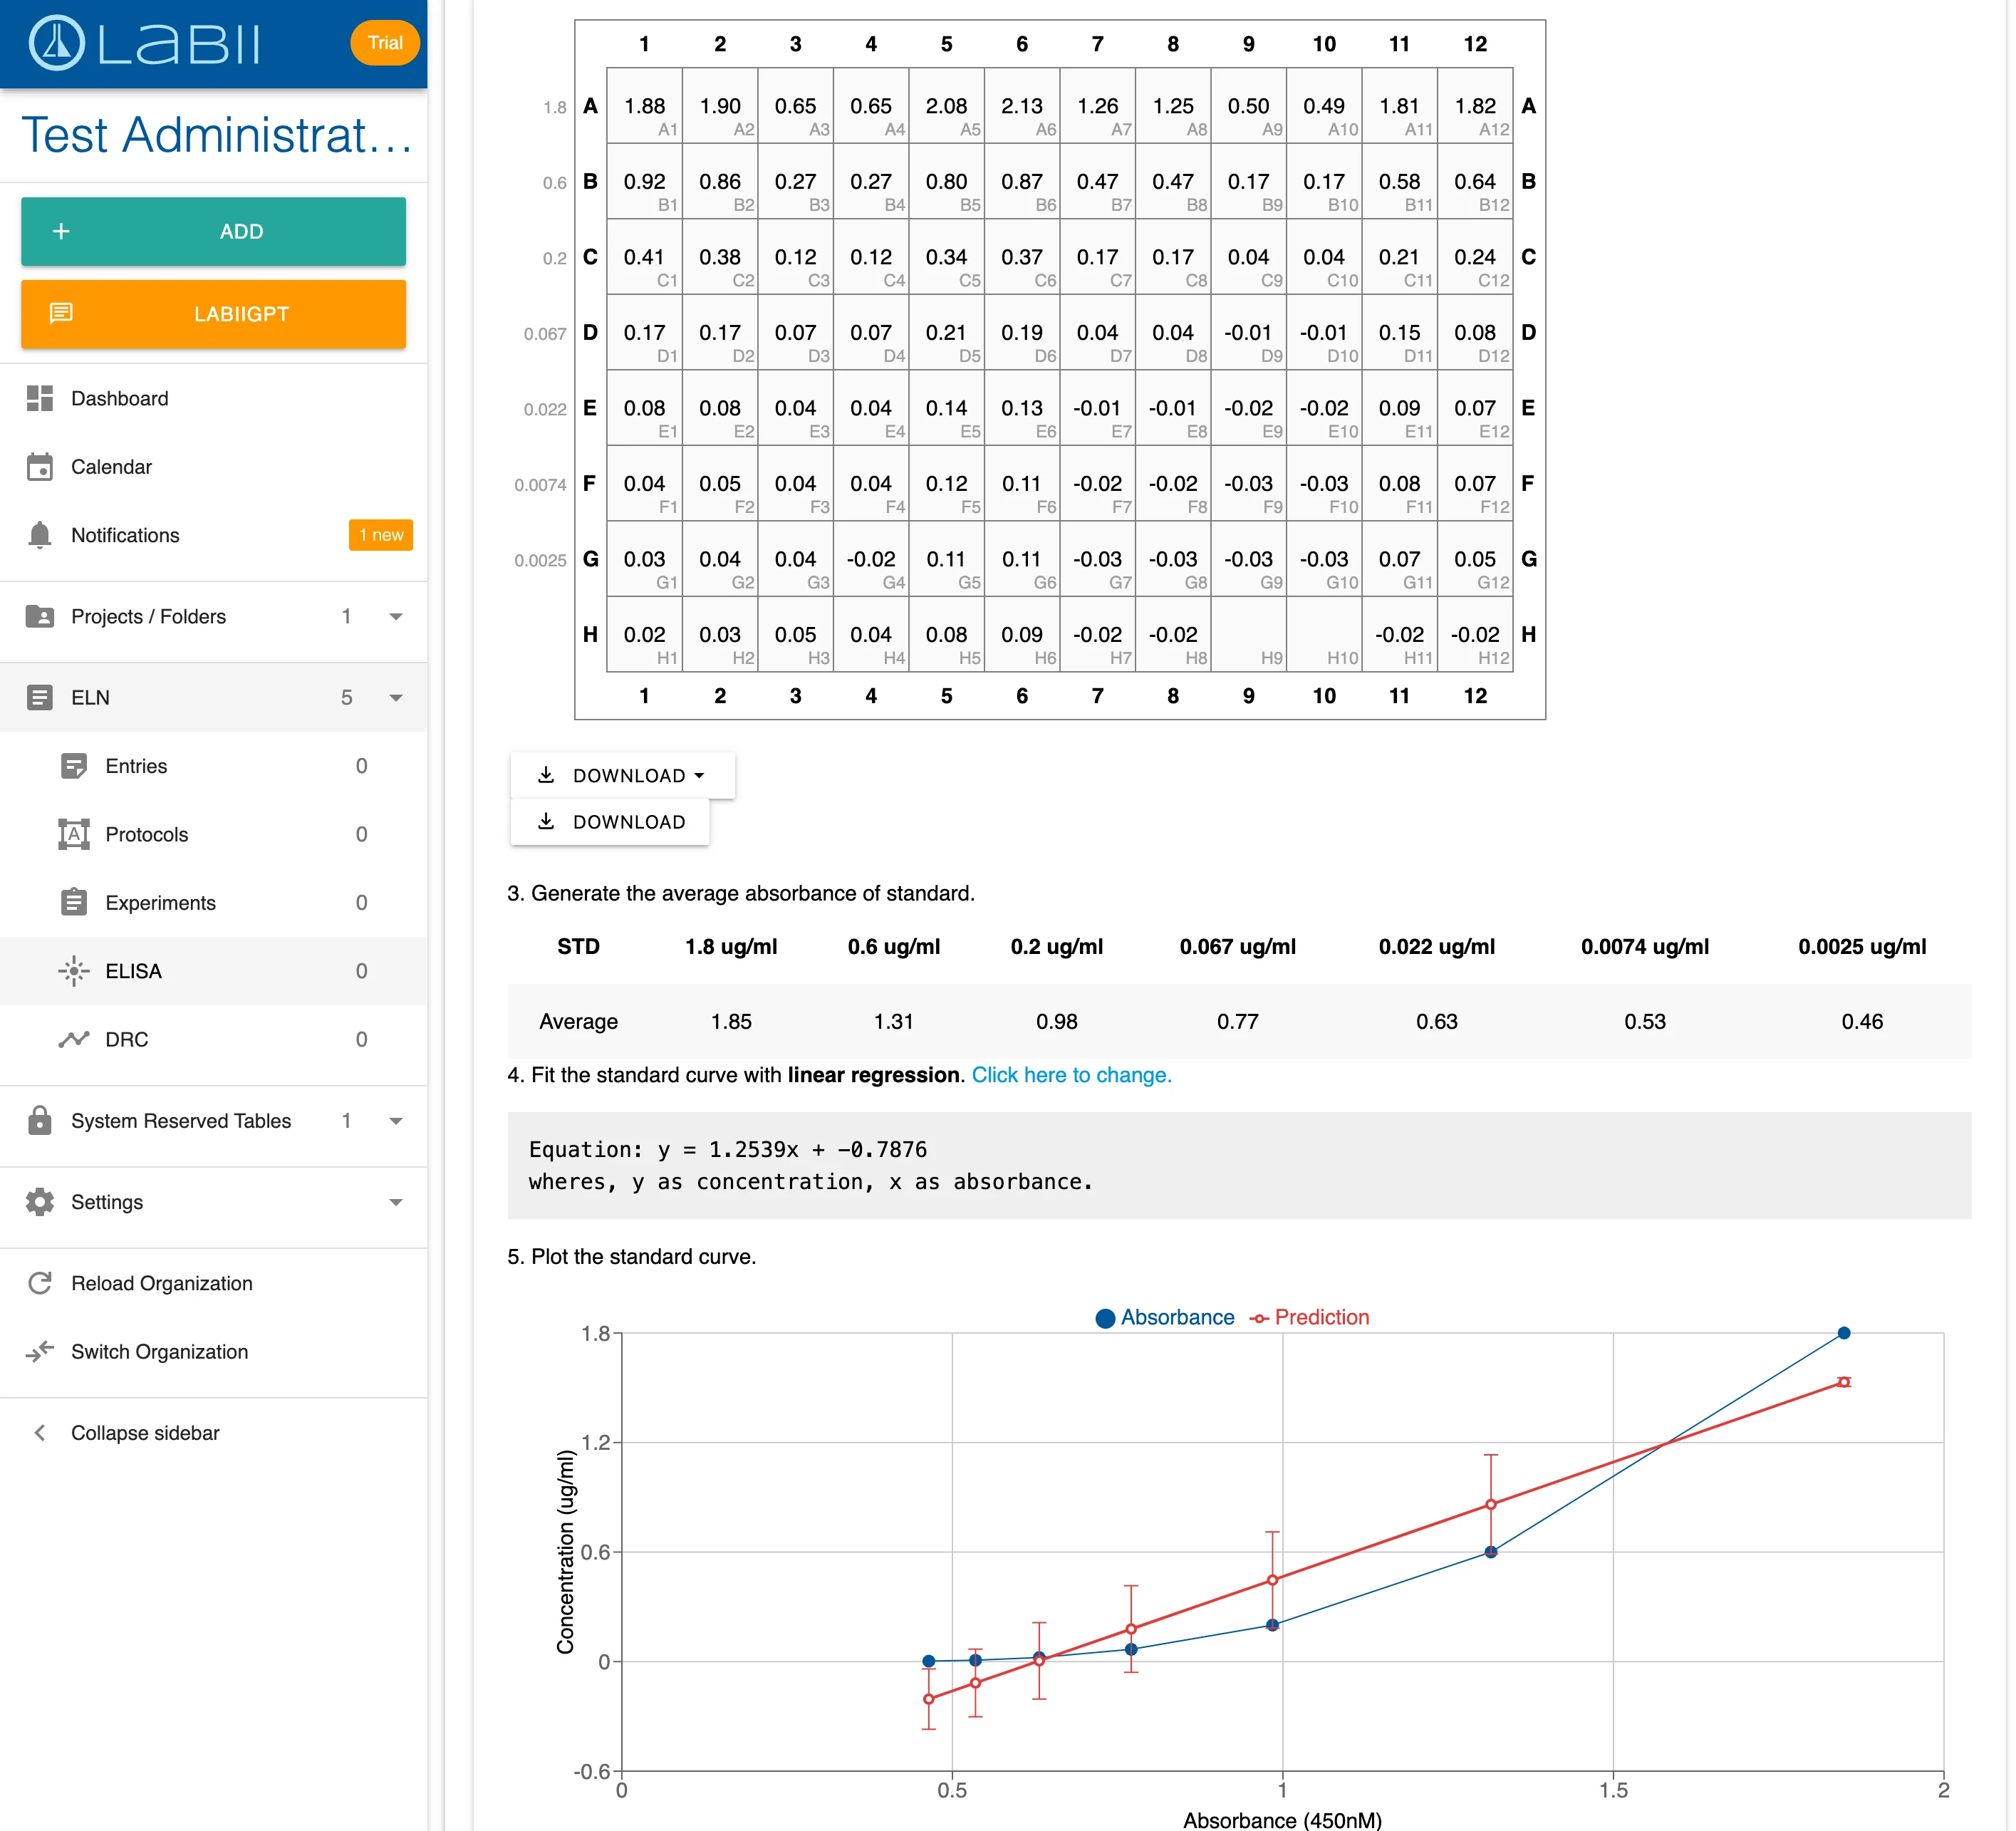
The ELISA Standard Curve widget provides integrated plate layout, data entry, and automated analysis